

Austin Real Estate Statistics - 2016

Click the image above to view the 2016 annual report for Texas

Click the image above to view the 2016 annual report for Austin
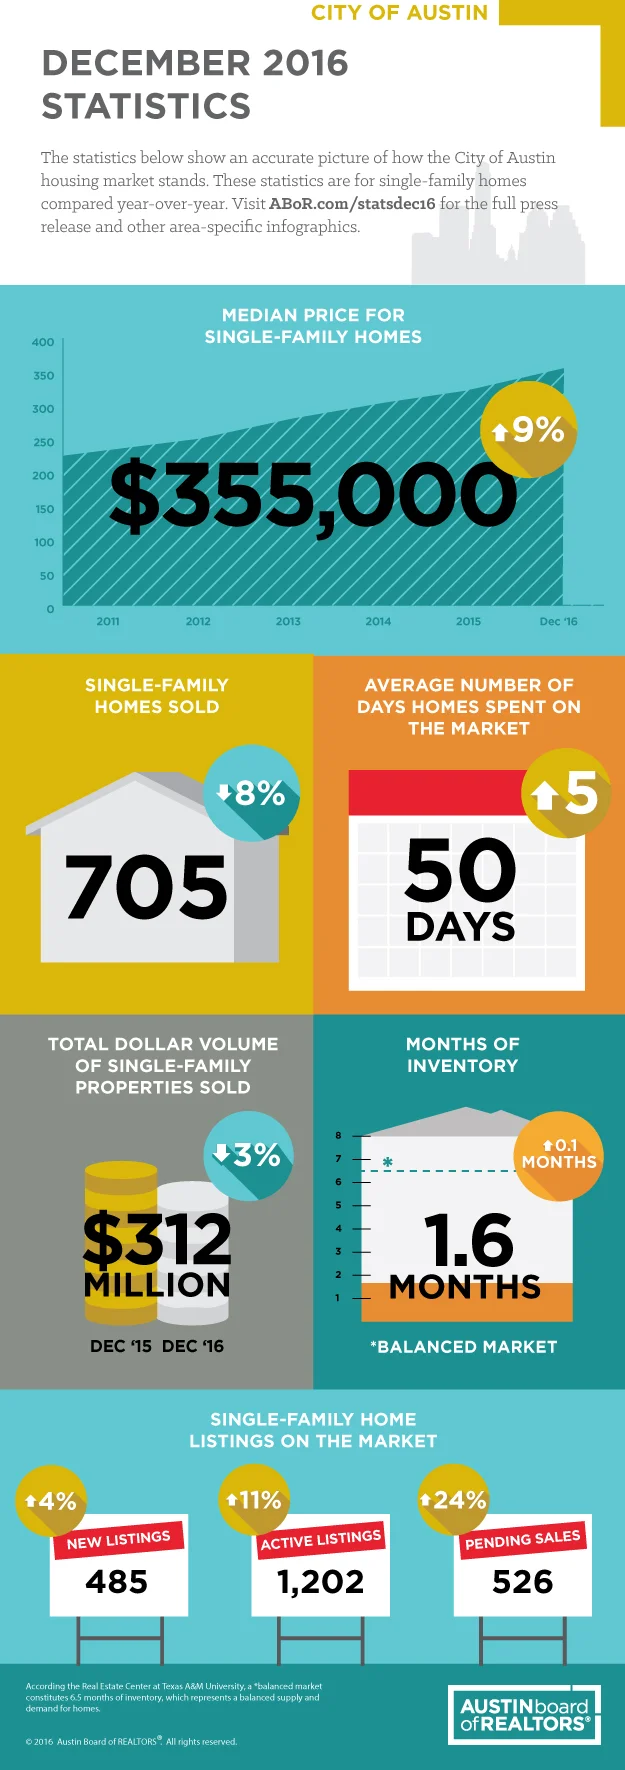
December 2016 STATISTICS
More than 29,000 (29,569) single-family homes were sold in the five-county MSA in 2016, a 3.9 percent increase from 2015 and an all-time high for annual home sales volume. Median price for single-family homes rose 7.2 percent from 2015 to $284,000, while home sales dollar volume jumped 9.1 percent from 2015 to $10,456,084,996. Homes spent an average of 50 days on the market in 2016, an increase of two days from 2015.
Housing inventory levels remained unchanged from year-end 2015 to year-end 2016, ending December 2016 at 2.0 months of inventory. This is two-thirds less than the Real Estate Center at Texas A&M University’s benchmark of 6.5 months as a balanced housing market. In December 2016, single-family home sales rose 1.9 percent year-over-year to 2,373 home sales, while median price rose 6.9 percent to $290,000.
Austin single-family home sales volume grew slightly in 2016, increasing 1.7 percent from 2015 to 9,049 home sales. Austin home prices rose at a more moderate pace than in years prior, with median price increasing 5.8 percent to $340,000 during the same time frame. Active listings jumped 16.5 percent annually to 1,461 listings and homes spent five more days on the market in 2016 than in 2015, or an average of 41 days.
In December 2016, city of Austin home sales declined 7.8 percent to 705 single-family home sales, while median price rose 9.2 percent to $355,000. Monthly housing inventory increased 0.1 months year-over-year to 1.6 months of inventory. Homes spent an average of 50 days on the market in December 2016, an increase of five days from December 2015.
November 2016 STATISTICS
Single-family home sales experienced double-digit growth across the Austin-Round Rock Metropolitan Statistical Area (MSA) in November, according to the November 2016 Central Texas Housing Market Report released by the Austin Board of Realtors.
Single-family home sales in the city of Austin jumped 13.7 percent annually to 656 home sales in November 2016. This double-digit growth was evident in Hays, Travis and Williamson Counties as well in November 2016, with single-family home sales experiencing annual gains of 24.2 percent, 11.3 percent, and 14.7 percent, respectively.
Home prices continued to climb in November 2016, but at a slower pace than in previous months. In the Austin-Round Rock MSA, median home price increased 7.0 percent year-over-year to $294,245, while median price in the city of Austin increased 4.0 percent year-over-year to $342,000. The exception was Williamson County, which experienced a 12.1 percent annual increase in median price to $275,000.
Housing inventory levels remained largely flat throughout the Central Texas region in November 2016. In the Austin-Round Rock MSA, monthly housing inventory levels remained flat at 2.3 months. In the city of Austin, housing inventory crept up 0.1 months year-over-year to 1.9 months.

October 2016 Statistics
After relatively flat growth throughout much of the year, single-family home sales in the city of Austin jumped 7.5 percent year-over-year to 703 home sales in October 2016. Median price increased 6.5 percent year-over-year to $332,250, while housing inventory increased 0.2 months to 2.2 months. Active listings increased 11.3 percent year-over-year to 1,667 listings during the same time frame, while homes spent slightly more time on the market, or an average of 42 days.
Conversely, single-family home sales fell across the Austin-Round Rock MSA in October 2016, declining 3.1 percent year-over-year to 2,219 home sales. Median price rose 9.3 percent from October 2015 to $279,000, while housing inventory edged up 0.1 months year-over-year to 2.6 months of inventory. Single-family homes spent an average of 51 days on the market in October 2016, two days more than October 2015.

September 2016 Statistics
In September, less than one in three homes sold in the Austin-Round Rock MSA and less than one in five homes sold in the Central Texas region were sold within Austin’s city limits. City of Austin single-family home sales declined 4.5 percent year-over-year in September 2016 to 746 home sales, while home sales across the Austin-Round Rock MSA increased 1.3 percent year-over-year to 2,576 home sales. Across the Central Texas region, single-family home sales were up 6.1 percent from September 2015.
During the same time frame, the median price for City of Austin homes increased 10.6 percent year-over-year to $345,000. Across the five-county MSA, the median price for single-family homes was $275,250, an increase of 7.5 percent from September 2015.

August 2016 Statistics
Single-family home sales also remained flat in the City of Austin in August 2016, increasing 0.8 percent year-over-year to 868 home sales. Median price increased 10.3 percent year-over-year to $356,276, while housing inventory increased 0.2 months to 2.3 months. Single-family homes spent an average of 35 days on the market in August 2016, two days more than August 2015.

JUly 2016 STATISTICS
Single-family home sales volume declined in the Central Texas area for the second time in 2016, according to the July 2016 Central Texas Housing Market Report released today by the Austin Board of REALTORS®. Across the Central Texas region, 4,230 single-family homes were sold in July 2016, a decrease of 3.1 percent compared to July 2015.
“When it comes to sales volume, we’ve grown very used to seeing year-over-year increases every single month, but it’s important to remember that 2015 had the strongest summer selling season in the region’s history,” said Aaron Farmer, 2016 President of the Austin Board of REALTORS®. “The value of Central Texas real estate has continued to increase, which is good news for homeowners, but those rising prices could start to have a cooling effect on sales volume in the market amidst growing affordability challenges.”
The median price for single-family home sales in Central Texas was $260,000 in July 2016, a 6.1 percent increase compared to the same month of the prior year. Over the same time period, Central Texas inventory levels were statistically unchanged at 3.6 months and homes spent an average of 48 days on the market, three days less than July 2015.
Narrowing in on the City of Austin specifically, the median price hit $345,000 in July 2016, a 4.6 percent increase from the year prior, while home sales volume declined by 7.3 percent to 870 homes sold. Housing inventory rose from 2.1 months in July 2015 to 2.4 months in July 2016 and homes spent four more days on the market than the previous year.

June 2016 Statistics
Despite ongoing housing affordability challenges, single-family home sales in the City of Austin increased 3.4 percent to 4,465 home sales in the first half of 2016. Of the 21,036 single-family homes sold in the 18-county Central Texas region in the first half of 2016, approximately only one in five (21 percent) were sold within the Austin city limits. Median price increased 5.6 percent to $339,652 in the first half of the year, while active listings jumped 20.1 percent to 1,298 listings during the same time frame.
In June 2016, Austin home sales increased 2.6 percent to 975 home sales, while median price increased only 2.9 percent to $350,000. Monthly housing inventory increased 0.3 months to 2.1 months, while homes spent a little more than one month (32 days) on the market on average, an increase of two days from June 2015.


April 2016 STATISTICS
According to the Multiple Listing Service (MLS) report released today by the Austin Board of REALTORS®, Austin-area single-family home sales increased 12.5 percent year-over-year to 3,863 home sales in the Central Texas region. Nearly 80 percent of those homes were sold outside of Austin’s city limits. In the five-county MSA, single-family home sales rose 5.1 percent year-over-year to 2,600 home sales during the same time frame.

March 2016 Statistics
According to the Multiple Listing Service (MLS) report released today by the Austin Board of REALTORS®, Austin-area single-family home sales increased 9.3 percent to 2,552 home sales in March 2016 compared to the same month the year prior. Median single-family home price also increased 7.8 percent year-over-year, reaching $278,000 in March 2016.
- 2,552 – Single-family homes sold, 9.3 percent more than March 2015.
- $278,000 – Median price for single-family homes, 7.8 percent more than March 2015.
- $347,734 – Average price for single-family homes, 4.5 percent more than March 2015.
- 54 – Average number of days single-family homes spent on the market, unchanged compared to March 2015.
- 3,633 – New single-family home listings on the market, 12.2 percent more than March 2015.
- 4,669 – Active single-family home listings on the market, 1.5 percent more than March 2015.
- 2,811 – Pending sales for single-family homes, 7.2 percent more than March 2015.
- 2.0 – Months of inventory* of single-family homes, 0.2 months less than March 2015.
- $887,419,074 – Total dollar volume of single-family properties sold, 14.1 percent more than March 2015.

February 2016 Statistics
According to the Multiple Listing Service (MLS) report released today by the Austin Board of REALTORS®, Austin-area single-family home sales increased by 2.9 percent to 1,783 home sales in February 2016 compared to the same month the year prior. Median single-family home price also increased 8.0 percent year-over-year, reaching $269,900 in February 2016.
- 1,783 – Single-family homes sold, 2.9 percent more than February 2015.
- $269,900 – Median price for single-family homes, 8.0 percent more than February 2015.
- $333,011 – Average price for single-family homes, 7.6 percent more than February 2015.
- 62 – Average number of days single-family homes spent on the market, three days more than February 2015.
- 2,793 – New single-family home listings on the market, 11.1 percent more than February 2015.
- 4,871 – Active single-family home listings on the market, 10 percent more than February 2015.
- 2,346 – Pending sales for single-family homes, 12.3 percent more than February 2015.
- 2.1 – Months of inventory* of single-family homes, 0.1 months more than February 2015.
- $593,758,953– Total dollar volume of single-family properties sold, 10.7 percent more than February 2015.

January 2016 Statistics
According to the Multiple Listing Service (MLS) report released today by the Austin Board of REALTORS®, Austin-area single-family home sales dropped slightly in January 2016 compared to the same month the year prior. Home sales decreased by 1.9 percent year-over-year to 1,459 home sales and median price increased 6.3 percent year-over-year, reaching $254,999 in January 2016.
- 1,459 – Single-family homes sold, 1.9 percent less than January 2015.
- $254,999 – Median price for single-family homes, 6.3 percent more than January 2015.
- $322,620 – Average price for single-family homes, 3.8 percent more than January 2015.
- 56 – Average number of days single-family homes spent on the market, seven days less than January 2015.
- 2,399 – New single-family home listings on the market, 8.0 percent more than January 2015.
- 4,751 – Active single-family home listings on the market, 11.4 percent more than January 2015.
- 2,207 – Pending sales for single-family homes, 16.6 percent more than January 2015.
- 2.0 – Months of inventory* of single-family homes, 0.1 months more than January 2015.
- $470,702,965 – Total dollar volume of single-family properties sold, 1.9 percent more than January 2015.
